If I was allowed to choose what would be the title of this post, it would have been Scilab’s First Assault on me. Well, honestly I’m not really an efficient programmer. Good thing, Ma’am Jhing provided us a very complete trial code. Programming was not really an issue this time. We only needed to change the functions that we were supposed to graph. The only problem that I had could only be blamed to me. You see, I failed to immediately realize the mathematical representation of the figures that we were supposed to plot.
The Scilab version I used was 5.2.1 with SIVP . Scilab as we all know is a free software. This version of Scilab worked perfectly with SIVP Toolbox (which was required for plotting the figures for me because, I think, my OS is Ubuntu. Also, I revised a bit of my code. The code provided utilizes a matrix (of zeros) to, by various and ingenious ways of manipulation, creates different images. So by changing the functions somewhere in the code a different image is generated.
Attached here is the code that I used to generate the images:
// 1centered square
nx = 500; ny = 500;
//definesthenumberoflements along x and y
x = linspace(-5,5,nx); //defines the range
y = linspace(-5,5,ny);
[X,Y] = ndgrid(x,y); //creates two 2-D arrays of xand y coordinates
r= sqrt(X.^2 + Y.^2); //note element-per-elementsquaring of X and Y
A = zeros (nx,ny);
A (find(abs(X)<2 & abs(Y)<2) ) = 1;
imshow(A)
im=rand(1000,1000);
ret = imwrite(A, ‘centeredsquare.png’);
// 2sinusoid
nx = 750; ny = 750; pi = 3.141592653589793238462643383 //definesthenumberoflements along x and y and defines pi
x = linspace(-10,10,nx); //defines the range
y = linspace(-10,10,ny);
[X,Y] = ndgrid(x,y); //creates two 2-D arrays of xand y coordinates
Y = sin(X.*pi);
imshow(Y)
im=rand(1000,1000);
ret = imwrite(Y, ‘sinusoid.png’);
// 3 gratings
nx = 500; ny = 500; //definesthenumberoflements along x and y
x = linspace(-5,5,nx); //defines the range
y = linspace(-5,5,ny);
[X,Y] = ndgrid(x,y); //creates two 2-D arrays of xand y coordinates
A = zeros (nx,ny);
A(find(abs(X)>0.1)) = 1;
A(find(abs(X)>0.25 & abs(X)>0.35)) = 0;
A(find(abs(X)>0.35 & abs(X)>0.55)) = 1;
A(find(abs(X)>0.55 & abs(X)>0.75)) = 0;
A(find(abs(X)>0.75 & abs(X)>0.95)) = 1;
A(find(abs(X)>0.95 & abs(X)>1.15)) = 0;
A(find(abs(X)>1.15 & abs(X)>1.35)) = 1;
A(find(abs(X)>1.35 & abs(X)>1.55)) = 0;
A(find(abs(X)>1.55 & abs(X)>1.75)) = 1;
A(find(abs(X)>1.75 & abs(X)>1.95)) = 0;
A(find(abs(X)>1.95 & abs(X)>2.15)) = 1;
A(find(abs(X)>2.15 & abs(X)>2.35)) = 0;
A(find(abs(X)>2.35 & abs(X)>2.55)) = 1;
A(find(abs(X)>2.55 & abs(X)>2.75)) = 0;
imshow(A);
im=rand(1000,1000);
ret = imwrite(A, ‘grating.png’);
//4 annulus
nx = 500; ny = 500;
//definesthenumberoflements along x and y
x = linspace(-5,5,nx); //defines the range
y = linspace(-5,5,ny);
[X,Y] = ndgrid(x,y); //creates two 2-D arrays of xand y coordinates
r= sqrt(X.^2 + Y.^2); //note element-per-elementsquaring of X and Y
A = zeros (nx,ny);
A (find(r<2.7 &r>1.7) ) = 1;
imshow (A);
im=rand(1000,1000);
ret = imwrite(A, ‘annulus.png’);
//5 Transparent Aperture
nx = 500; ny = 500; pi = 3.141592653589793238462643383
//definesthenumberoflements along x and y
x = linspace(-5,5,nx); //defines the range
y = linspace(-5,5,ny);
[X,Y] = ndgrid(x,y); //creates two 2-D arrays of xand y coordinates
r= sqrt(X.^2 + Y.^2); //note element-per-elementsquaring of X and Y
A = zeros (nx,ny);
A (find(r<4.7) ) = 1;
b = A.*exp(-0.1*pi*r);
imshow (b)
im=rand(1000,1000);
ret = imwrite(b, ‘transparency.png’);
Oh, by the way, the images that we were required to reproduce are: a centered square aperture, a sinusoid along the x-axis, grating along the x-direction, an annulus, and an aperture with graded transparency.
 Figure 1. The Centered-square Aperture (500×500)
Starting with the centered square, it was generated using the code snippet:
A (find(abs(X)<2 & abs(Y)<2) ) = 1;
Since we already have am matrix of zeros , the above code modifies the elements of the matrix that have the absolute value of X and Y coordinates less than 2, to 1. The elements then display the value of 1 which corresponds to a “white” aperture on the center of the plot.
Figure2. Sinusoid along the x direction (750×750)
The 2nd image requires a sinusoid along the x-direction. At first I found my intial results to be weird because I did not know that Scilab had inverted their orientation of their x and y-axes. The code for the sinusoid should have been a very easy one-liner:
Y = sin(X.*pi)
Unfortunately, because of the inversion of Scilab I took more time than neceesary. Also despite its apparent simplicity it took quite a while for me to figure out its mathematical representation.
 Figure3. Grating along the x-direction(500×500)
The third part of the activity was a grating along the x axis. For now I used this inefficient bit of code to generate the grating.
A(find(abs(X)>0.1)) = 1;
A(find(abs(X)>0.25 & abs(X)>0.35)) = 0;
A(find(abs(X)>0.35 & abs(X)>0.55)) = 1;
A(find(abs(X)>0.55 & abs(X)>0.75)) = 0;
A(find(abs(X)>0.75 & abs(X)>0.95)) = 1;
A(find(abs(X)>0.95 & abs(X)>1.15)) = 0;
A(find(abs(X)>1.15 & abs(X)>1.35)) = 1;
A(find(abs(X)>1.35 & abs(X)>1.55)) = 0;
A(find(abs(X)>1.55 & abs(X)>1.75)) = 1;
A(find(abs(X)>1.75 & abs(X)>1.95)) = 0;
A(find(abs(X)>1.95 & abs(X)>2.15)) = 1;
A(find(abs(X)>2.15 & abs(X)>2.35)) = 0;
A(find(abs(X)>2.35 & abs(X)>2.55)) = 1;
A(find(abs(X)>2.55 & abs(X)>2.75)) = 0;
One who knows programming, even if it’s just a bit (like me) could easily this code could still be improved. It basically modifies the matrix so that it would output alternating black and white strips. Since the reguired image is just a repeating alternate strips, one could say that it would be best to use a loop for this part. Unfortunately, at the moment, I’m not that well versed with Scilab loops, that’s why I have settled for this bit of bulky, inefficient code.
 Figure4. The Annulus (500×500)
The 2nd to the last image is an annulus. This was the first image that apealed to me, since it’s very similar to the introductory code that was given to us. I also found it the easiest to genrate.
A (find(r<2.7 &r>1.7) ) = 1;
This code specifies the area in the matrix of zeroes (black) that will be white. Basically it, just with the introductory code but then we defined another radius to mark the beginning of the inner circle.
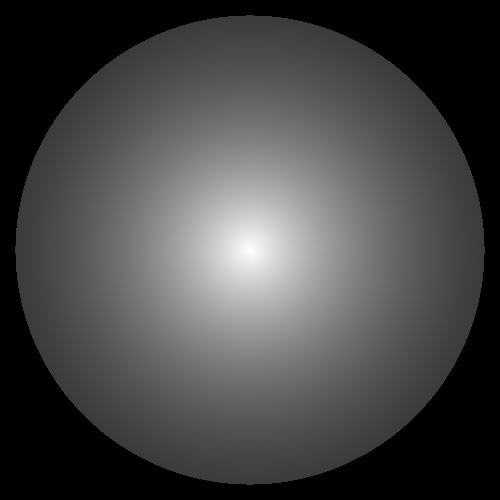
 Figure5. Aperture with gaussian transparency
The last image is also similar to the aperture of the introductory code , only it required to have a graded transparency or Gaussian transparency
b = A.*exp(-0.1*pi*r);
The code for the aperture was multiplied to an exponential decaying function. The constants in the exponent should be negative to achieve the gradually darkening behaviour of the aperture. Also after playing the constant, it is found that as the constant gets higher, that is more negative, the aperture greys rapidly.
I would like to thank Ma’am Jhing for providing the class the very useful aperture code, for showing to the class the required images, without which I would have a harder time knowing if my output is correct. To Mr. Dennis Diaz, for reminding the mathematical representation of a square, to Jonathan Abat for his comments on my Figure 5, and to Nemesio Mangila for his invaluable insights regarding the activity.
For my self-evaluation, I think I would like to grade myself with 8 since I think I was able to do the required output, but because I lacked the motivation, I think, to make the blog.
The last image is also similar to the aperture of the introductory code , only it required to have a graded transparency or gaussian transparency
b = A.*exp(-0.1*pi*r);
The code for the aperture was multiplied to an exponential decaying function. The constants in the exponent should be negative to achieve the gradually darkening behavior of the aperture. Also after playing the constant, it is found that as the constant gets higher, that is more negative, the aperture grays rapidly.
I would like to thank Ma’am Jhing for providing the class the very useful aperture code, for showing to the class the required images, without which I would have a harder time knowing if my output is correct. To Mr. Dennis Diaz, for reminding the mathematical representation of a square, to Jonathan Abat for his comments on my Figure 5, and to Nemesio Mangila for his invaluable regarding the activity.
![]()
![]()
![]()
![]()

